Lecture 5
Self-Avoiding Chain
- A self-avoiding chain is a freely jointed chain the does not cross over itself.
- One of the first scientists to work on this problem is Flory.
- We want to quantify how the chain avoids crossing itself. This is done by examing the free energy of the chain.
Free Energy Discussion:
We need expression for the energy and the entropy of the self-avoiding chain.
- Approximate the entropy as that of the FJC.
- Energy term will be used to penalize crossing over.
- Consider a single monomer (link) along the chain.
- Assign an energy penalty for having non-neighboring monomers near the monomer .
- Let this number be described by the density of monomers multiplied by some small volume that encolses the monomer .
- Assign an energy penalty for having non-neighboring monomers near the monomer .
- Consider a single monomer (link) along the chain.
We want to minimize with respect to to figure out the optimal size of the chain.
This is an important result! For the self-avoiding chain whereas for the other models .
Aside: DNA
DNA behavior is well predicted by that of a worm-like chain. We know the following for a worm-like chain:
Lets examine the RMS length of DNA from different organisms.
- Lambda Phage
- ;
- ;
- E Coli
- ;
- ;
- Human Cell
- ; (Cell Nucleus)
- ; (Cell Nucleus)


In each case the RMS length of the DNA is much bigger than the size of it’s enclosing cell structure. Single cell organisms like Lambda Phage and E Coli take care of this by having very hard cell walls to keep DNA enclosed at a high pressure. In human cells however, the nucleus walls of very weak. Tight packing of DNA into chromosomes ensures that the DNA to remains contained in the nucleus.
Concluding Remarks about Polymers
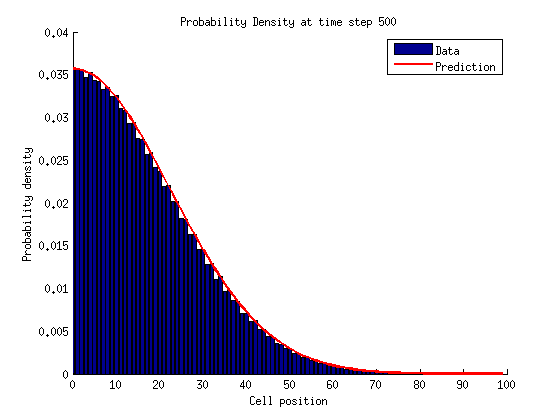
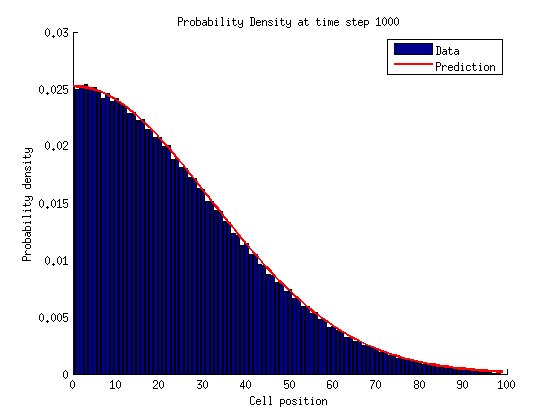
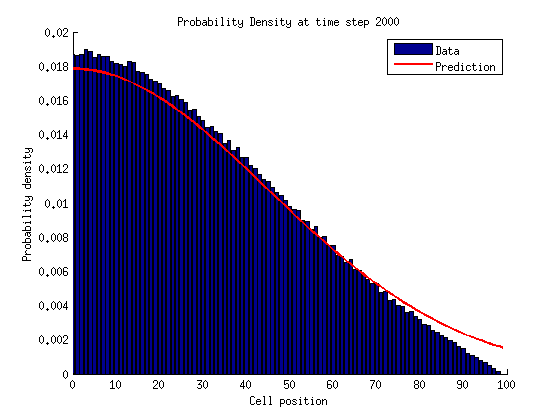
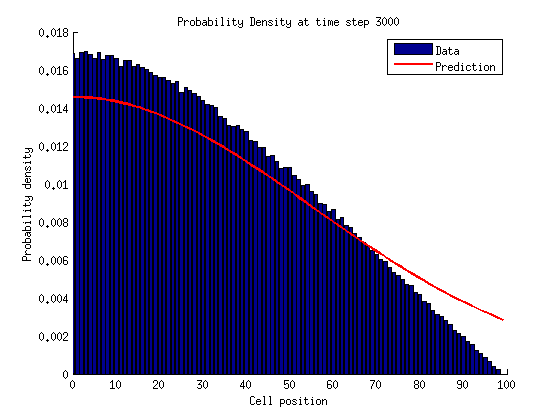
The MSD distance of a polymer always has behaves like something of the form:
- If then the polymer is floppy and dense.
- If then the polymer is straight and stiff.
Lipids
Lipids are molecules found in cells and one of their functions is to group together forming cell membranes. Consists of a head and a tail. The head is hydrophilic - attracted to water - while the tail is hydrophobic - repelled by water.

An example of the different kind of groupings lipids can make.
Do Lipids Always Self-Assemble into Membranes?
There is a trade off between lipids being spread apart or grouped together like in membranes.
- Free Lipids
- High entropy
- High energy
- Grouped Lipids
- Low entropy
- Low energy
Free Energy Discussion
Hypothesis: lipids transition from free to grouped when .
We can quantify the energy of a single lipid assuming that it has an approximately cylindrical shape as:
For free lipids, we can approximate the entropy of a single lipid as that of an ideal gas particle.
For an ideal gas the average energy . Now lets put this all together to calculate , the energy at which we hypothesized free lipids will group together.
This final expression above is the transition energy. Lets find the corresponding density where the transition occurs.
So the prediction is that where is the length of the lipid’s chain. It turns out that this corresponds to very low critical densities. Therefore, even at low lipid density they easily start packing together.
Written with StackEdit.