1D Diffusion Notes
1 Cell Diffusion with No State Switching
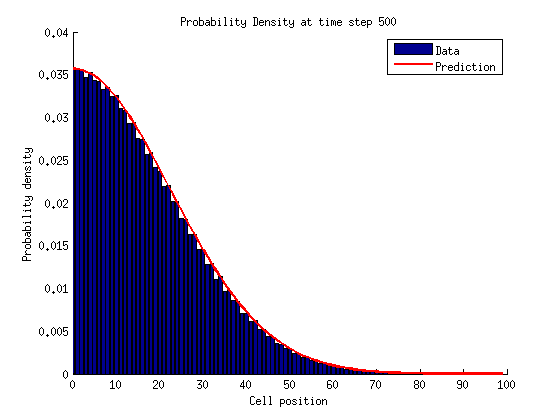
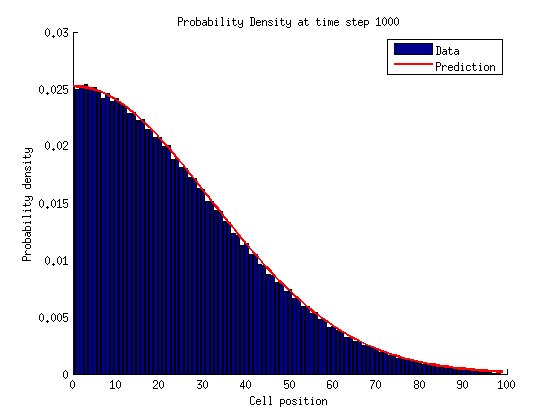
Prediction
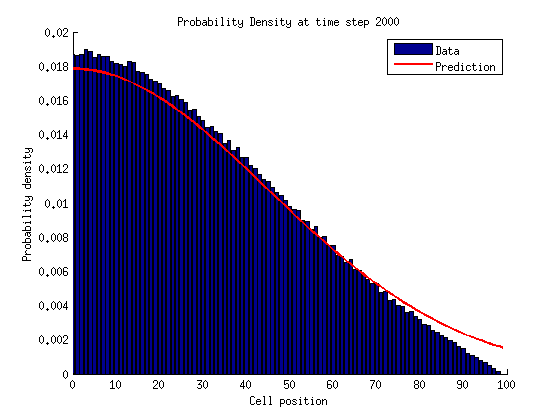
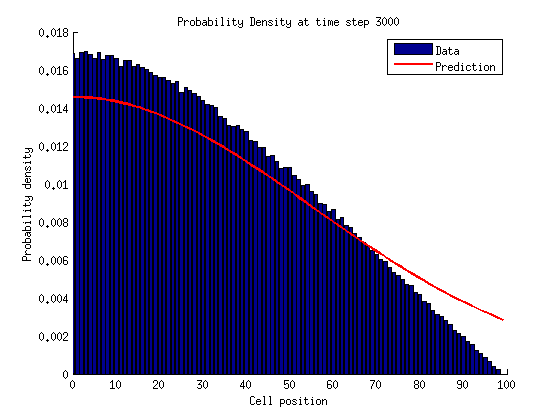
The probability density for cell location given a time should look like a normal distribution. As time increases this prediction becomes less accurate since more and more particles get absorbed at the right side boundary.
The extra factor of two in is because of the reflective boundary at the origin. In an 1D random walk so , therefore , and .
Results
At small times the data is very much inline with prediction.
At large times the data starts to diverge from a normal distribution as more and more cells are absorbed.
Prediction
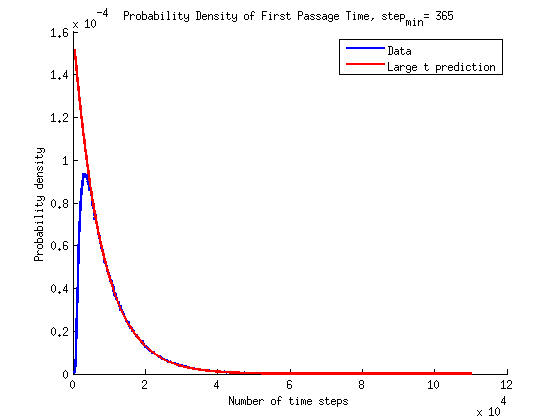
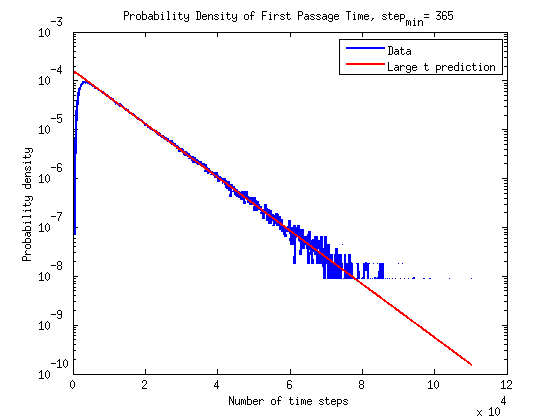
is the probability density of the first passage time. It is expressed as the following:
This equation has a solution for our set of initial and boundary conditions. In the large time limit this solution can be expressed as:
In the following plots only the first term, , from the series is used.
Results - Update
The results are plotted here on a normal scale and on a semilog scale. The prediction at large times does seems to be in agreement with the simulations. Update, I have since gone back and remade the plots as a histogram. In creating the histograms I weight the probability density in each bin by the width of the bin to ensure that the whole probability density is properly normalized.
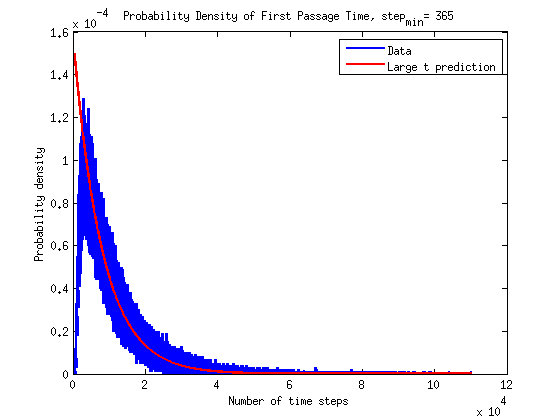
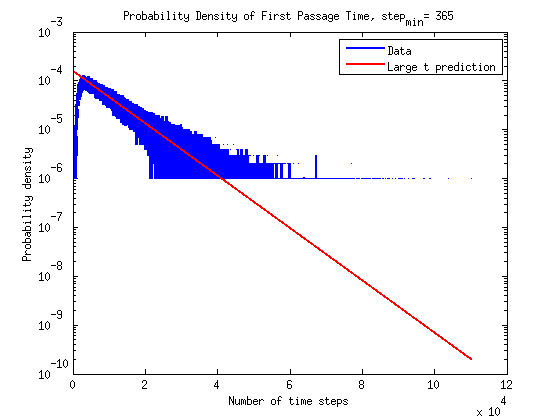
Old Plots
I believe the thickness of the band in the data is due in part because of the large time scale plotted and that on small timescales there is lots of variation in the probability density.
Written with StackEdit.
No comments:
Post a Comment